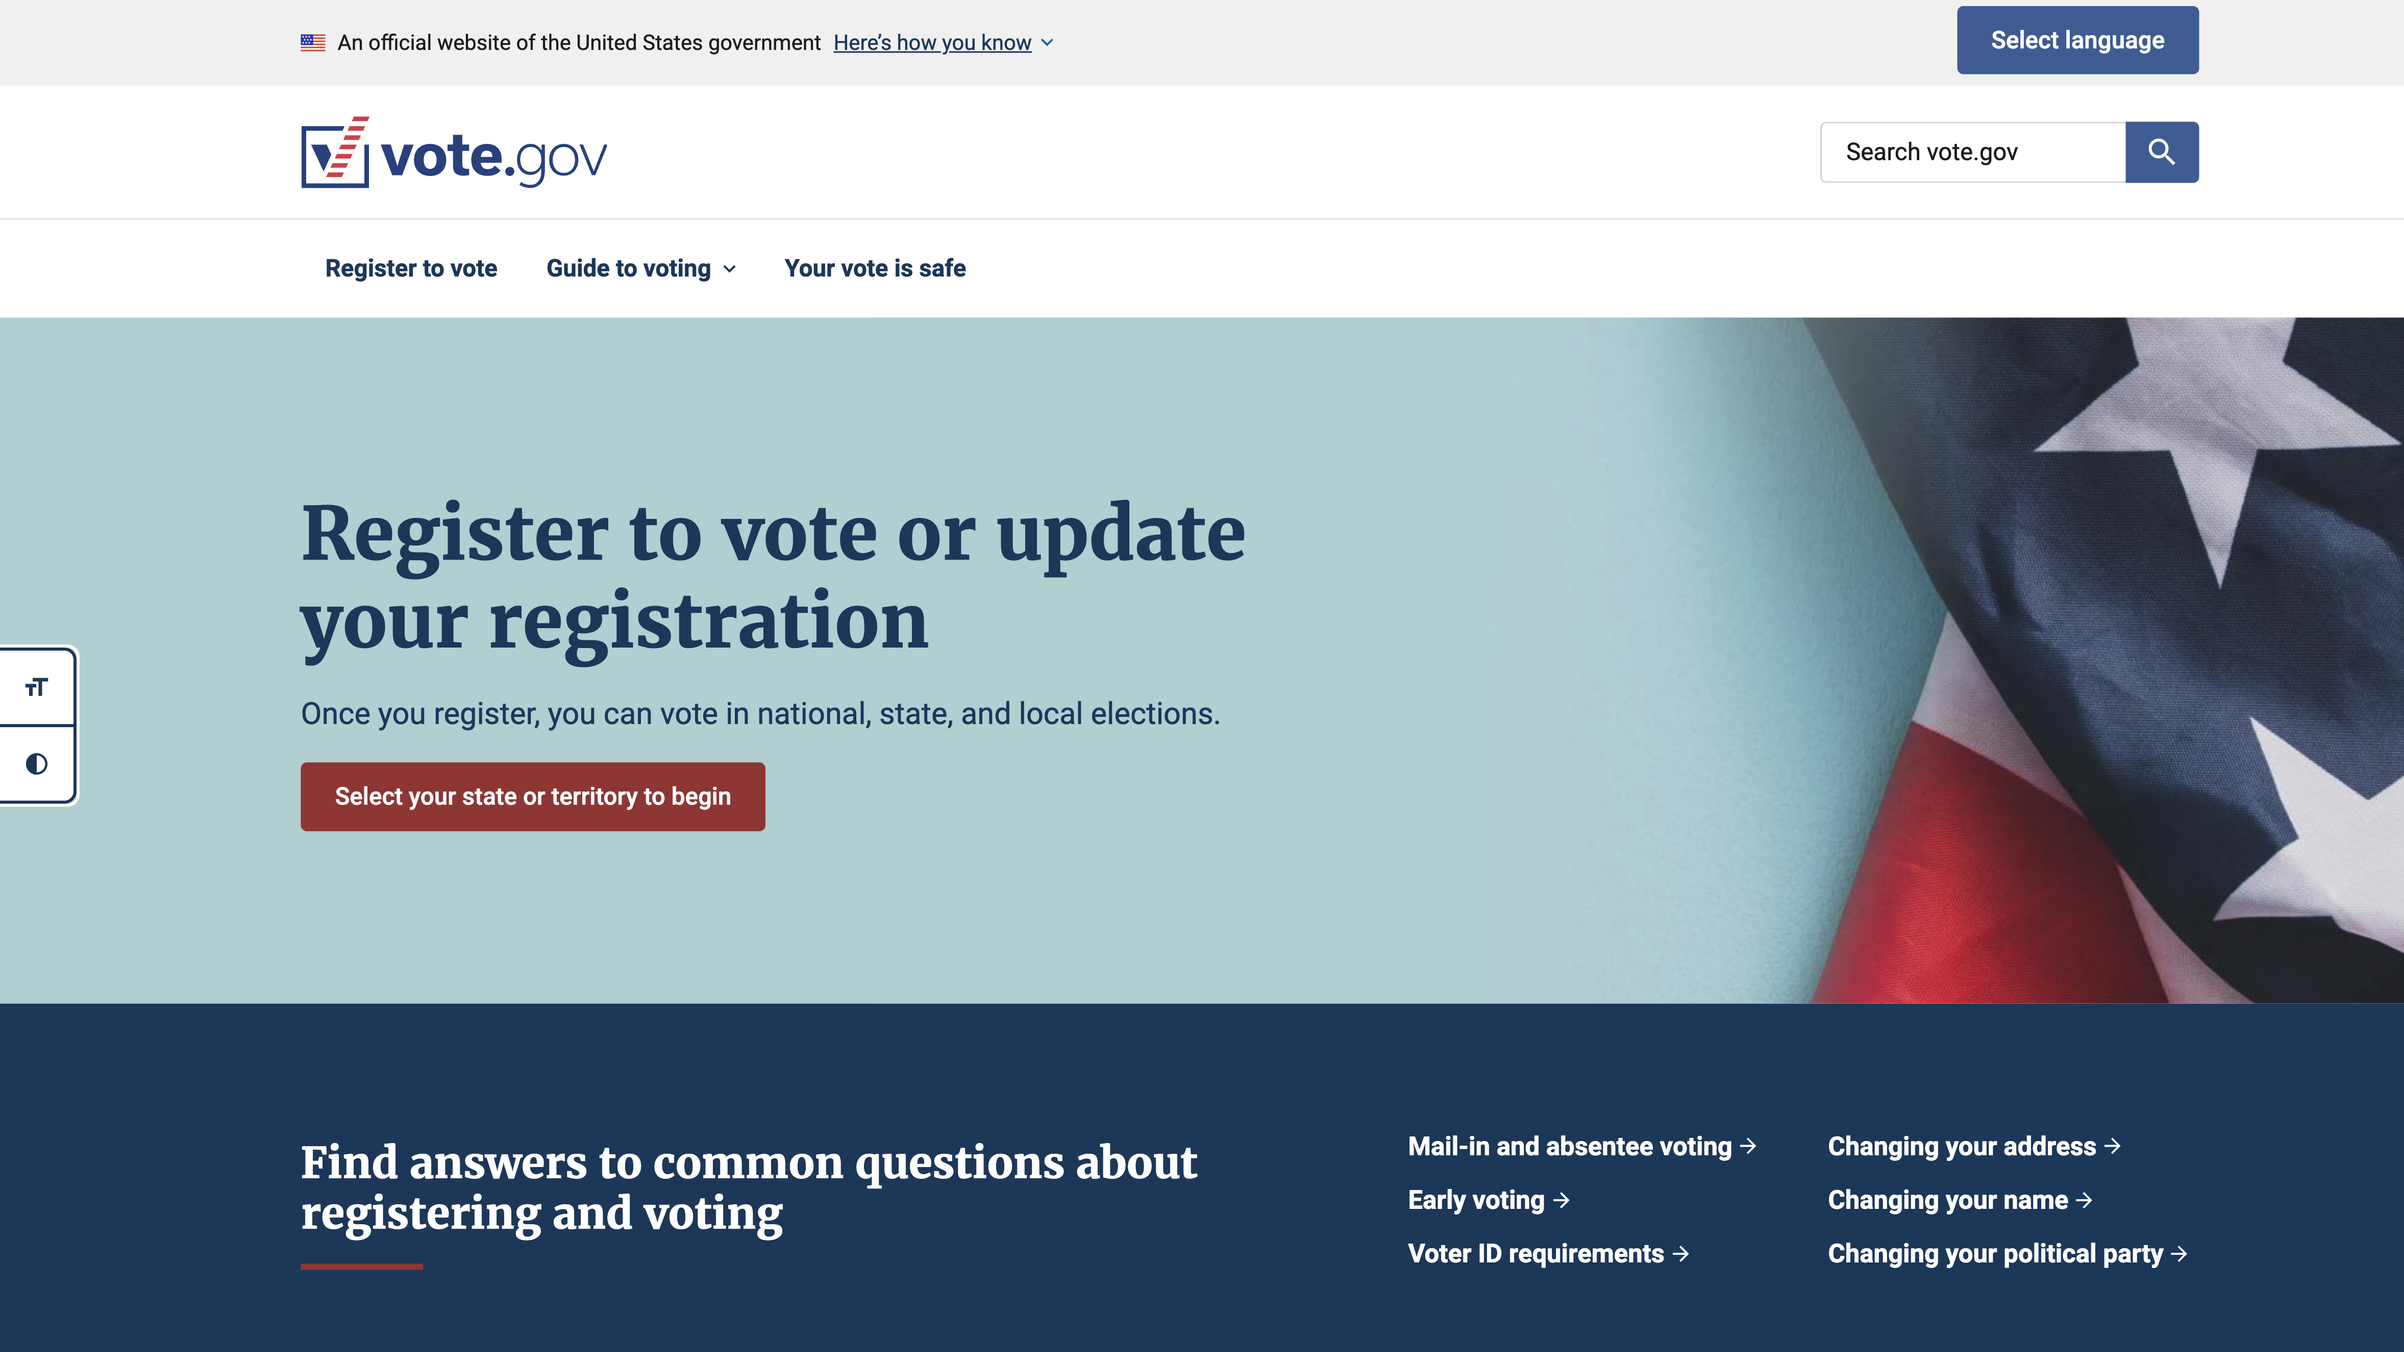
Vote.gov
Supporting the launch and evaluating the impact of a new vote.gov during the 2024 election cycle
Challenge
With over 11 million users during the 2024 election year, vote.gov needed to understand whether its newly redesigned platform was effectively serving all eligible voters—particularly those facing language, accessibility, and situational barriers. The site had launched major improvements mandated by Executive Order 14019, but lacked comprehensive data on whether these investments were actually making a difference for the American public.
Client
vote.gov, U.S. General Services Administration (GSA)
The federal government's official voting information resource, serving as a non-partisan aggregator directing citizens to state-specific election information.
Contribution
Lead UX Researcher & Impact Analyst
I designed and executed a multi-method research strategy combining analytics, population data, stakeholder interviews, and user testing to evaluate impact across six primary goals. I also consulted on the July 2024 site launch, conducting user testing, optimizing search functionality, and advising on visual design decisions to ensure consistency and representation.
Impact
Validated 9,000-10,000 voter registrations attributable to vote.gov during September 2024 debate traffic surge through statistical modeling
Demonstrated proportionate reach across demographics: non-English content reached 4.4% of users vs. 5.7% LEP population
Confirmed 53% completion rate for National Voter Registration Form tool—exceeding industry benchmarks
Established baseline metrics for measuring accessibility impact across 40+ million eligible voters with disabilities
Improved search experience by cleaning up outdated results and surfacing high-priority content based on user query analysis
Enhanced navigation and content based on insights from users who struggled to complete tasks on the site
Approach
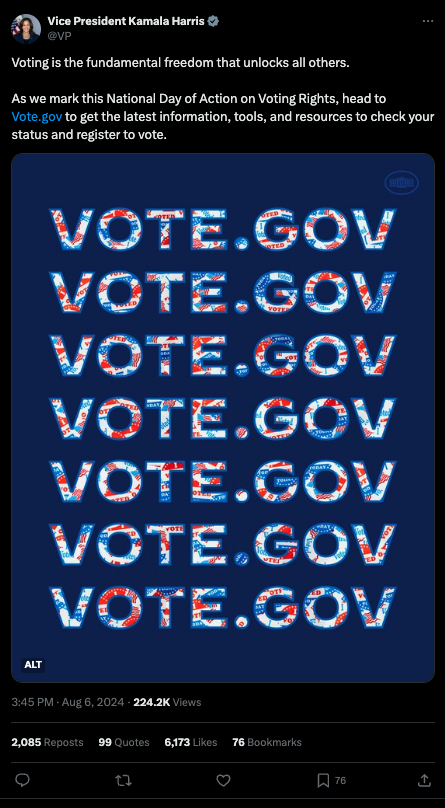
Vote.gov had a lot of visibility during the 2024 election cycle, pointed to by official government accounts and celebrities alike.
Because vote.gov doesn't collect personally identifiable information and can't directly track users through to voter registration completion, I developed a multi-method evaluation framework that assessed each of vote.gov's six primary goals using appropriate methodologies.
Quantitative analysis
Google Analytics deep dives on 11M+ users (August-November 2024)
Statistical modeling of state registration data during traffic surges
Population-to-user ratio calculations across languages and demographics
Qualitative research
Stakeholder interviews with language access and accessibility advocacy organizations (NALEO, APIA Vote, Asian Americans Advancing Justice, The ARC)
Unmoderated UserTesting studies with bilingual participants (Spanish, Chinese, Korean; N=24)
Recruited and interviewed 10 real vote.gov users who struggled to complete tasks, surfacing actionable navigation and content improvements
Content testing with target populations for voter guides
Comparative analysis
Competitive landscape evaluation against 7 major voter information platforms
Census data integration for population coverage assessment
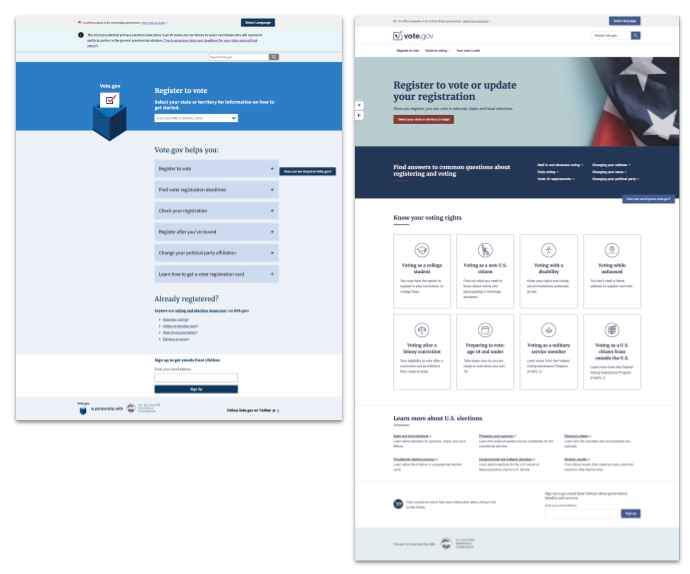
Before and after the 2024 re-launch of vote.gov
Site optimization consulting
Beyond the impact evaluation, I contributed to the July 2024 site launch by implementing a Touchpoints feedback form that enabled direct user recruitment, optimizing search.gov functionality by monitoring queries and cleaning up outdated prioritized results, and consulting on imagery to ensure consistency and representative depiction of the diverse electorate. Analysis of search terms in English and Spanish helped identify content gaps and inform homepage priorities.
Key findings
State referrals and impact attribution
Challenge: Vote.gov doesn't register voters directly—it refers them to states. How do we measure success when the moment of conversion happens on another platform?
Approach: When Taylor Swift shared a link to vote.gov following the September 10 presidential debate, it created a natural experiment. The site handled 500,000+ requests in five minutes without downtime. Because her referral link was uniquely trackable, I saw an opportunity to measure impact.
Working with statistician Jake Bowers, I requested registration data from states with online registration. Four states—Colorado, Rhode Island, South Carolina, and Oregon—shared their numbers. We compared users who clicked from vote.gov to each state's website against the number of online registrations recorded, calculating the maximum possible registrations attributable to vote.gov as the lesser of those two numbers.
Using the week before the debate (September 3-9) as baseline, we modeled expected registration numbers for September 10-11, then compared predictions against actual registrations.
Key findings:
Identified 9,000-10,000 registrations beyond baseline expectations across four states
Swift's unique referral link accounted for 34% of state site clicks, attributing 3,000-3,400 registrations specifically to her endorsement
Demonstrated vote.gov's value as an authoritative aggregator that amplifies influencer/celebrity impact
65% overall click-through rate from vote.gov state pages to state election websites
Consistent 1-2% reach across all states and territories relative to eligible voter population
Strategic insight: This analysis proved vote.gov's impact despite structural tracking limitations. The path forward requires state partnerships with ongoing referral tracking through data-sharing agreements, plus clearer messaging about vote.gov's aggregator role to manage user expectations.
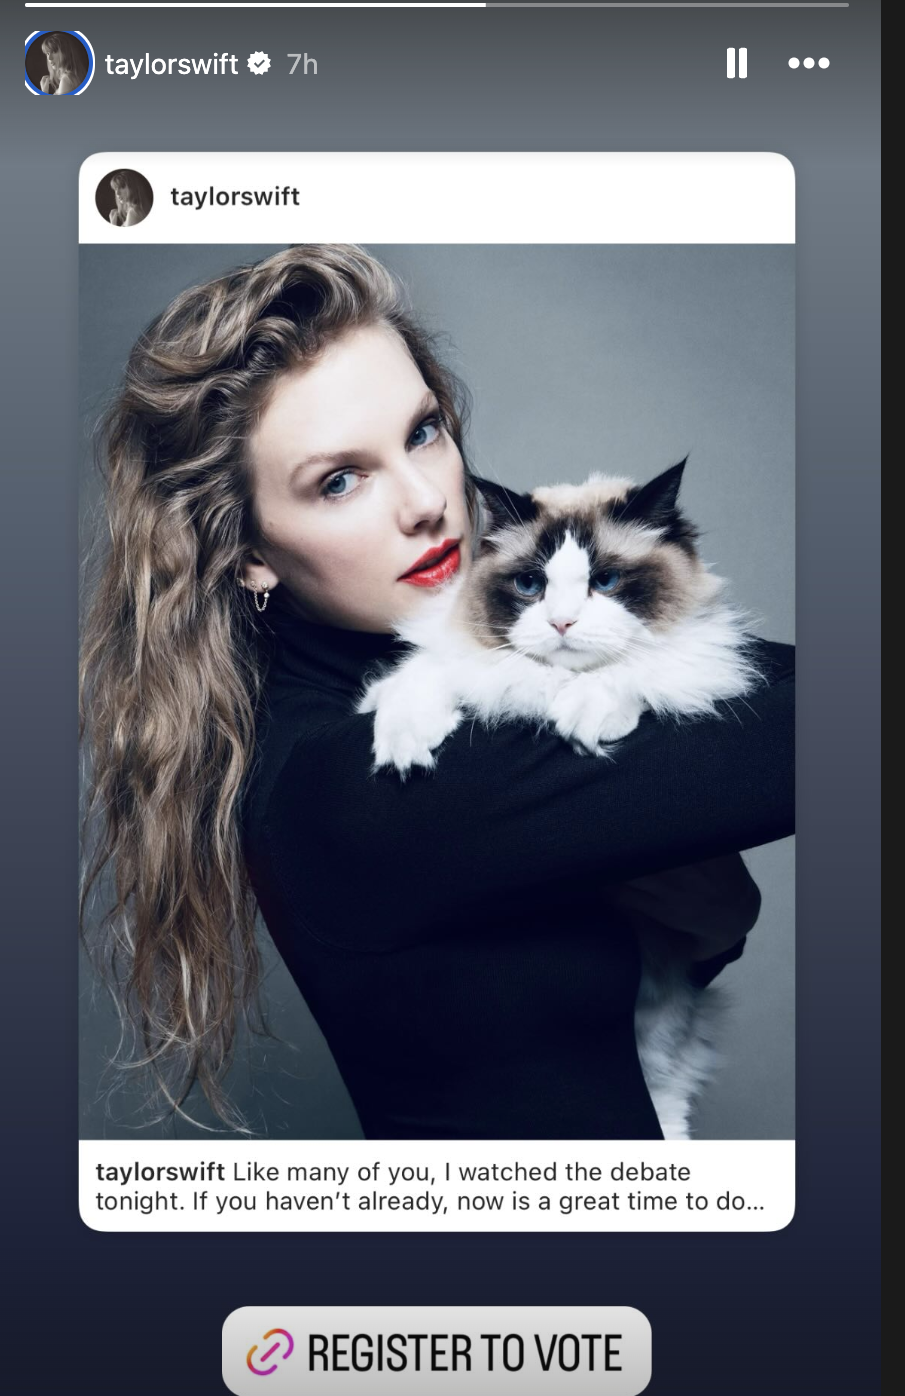
Taylor Swift shared a link to vote.gov on her stories encouraging her followers to register to vote
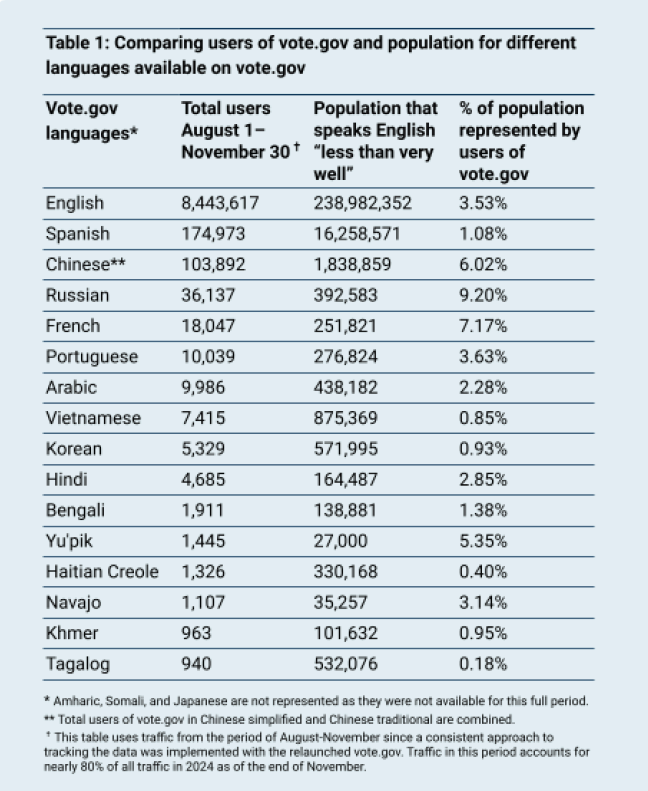
Table comparing users of vote.gov by language (based on Google Analytics data) and population size (based on estimates extrapolated from Census data) for languages available on vote.gov
"There were many languages listed and it's impressive. It shows the degree that government is seriously investing in including LEP people. Recently, for instance, my parents received ballot information in Korean. It shows government really strives for inclusion."
— Participant in Korean-language study
Language access and translation quality
Challenge: Vote.gov invested heavily in human translation for 20 languages covering 97% of the American population. Was the investment reaching its intended audience, and did translation quality affect trust?
Approach
Analyzed traffic-to-population ratios across all languages using Census data
Conducted UserTesting studies with 24 bilingual participants rating translation quality and impact on trust
Interviewed language access advocacy organizations about community needs and dissemination strategies
Analyzed user session data to understand discovery patterns
Key findings
Non-English pages reached 4.4% of total users, aligning proportionally with 5.7% LEP eligible voter population
Ratio of users to population was consistent across most languages at 1-3%
Participants rated vote.gov translations 6.1/7 for quality vs. 5.6/7 for government sites generally
Multiple participants explicitly connected high-quality translations to increased trust in both content and government
74-84% of non-English users arrived at vote.gov already in their preferred language via search engines
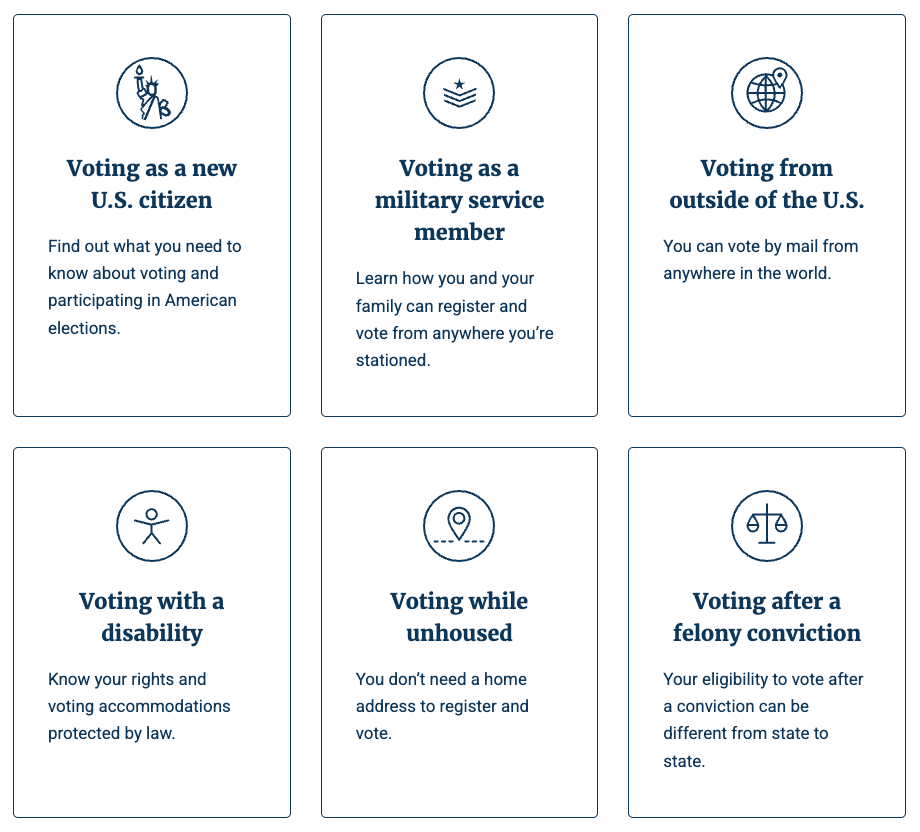
"Voting as a new U.S. citizen" guide was most-visited guide in 11 of 18 non-English languages
Strategic insight: The investment in human translation paid off in both reach and trust, but impact could be amplified significantly through partnerships with ethnic media and community-based organizations rather than relying solely on organic search discovery. Advocacy groups emphasized that trusted messengers are essential for reaching LEP communities.
Accessibility and universal design
Challenge: How do you evaluate accessibility impact when you can't track assistive technology use, and the population of people with disabilities is highly diverse?
Approach
Conducted objective accessibility audit against WCAG 2.1 Level AA standards and Section 508 requirements
Gathered feedback from accessibility advocacy organizations who shared vote.gov with their communities
Ran UserTesting study with ADHD participants (N=9) on website usability
Evaluated National Voter Registration Form tool completion rates and user feedback
Consulted on design decisions throughout site development
Key findings
Vote.gov met or exceeded all accessibility requirements with no significant violations
NVRF form tool achieved 53% completion rate—exceptionally high for government forms; the tool made 27-page PDF accessible on mobile devices and with screen readers
Users with disabilities validated that prioritized features (plain language, logical organization, zoom capabilities, clear navigation) genuinely improved experience; more than half of accessibility advocacy respondents noted thoughtful features enhanced trust
ADHD participants praised calm design, absence of distractions, and clear information hierarchy
Estimated 40+ million eligible voters with disabilities potentially benefited from improvements
Strategic insight: Meeting standards is essential, but providing truly accessible experiences requires ongoing testing with users with disabilities and continued partnership with advocacy community—both for improvement feedback and amplified dissemination.
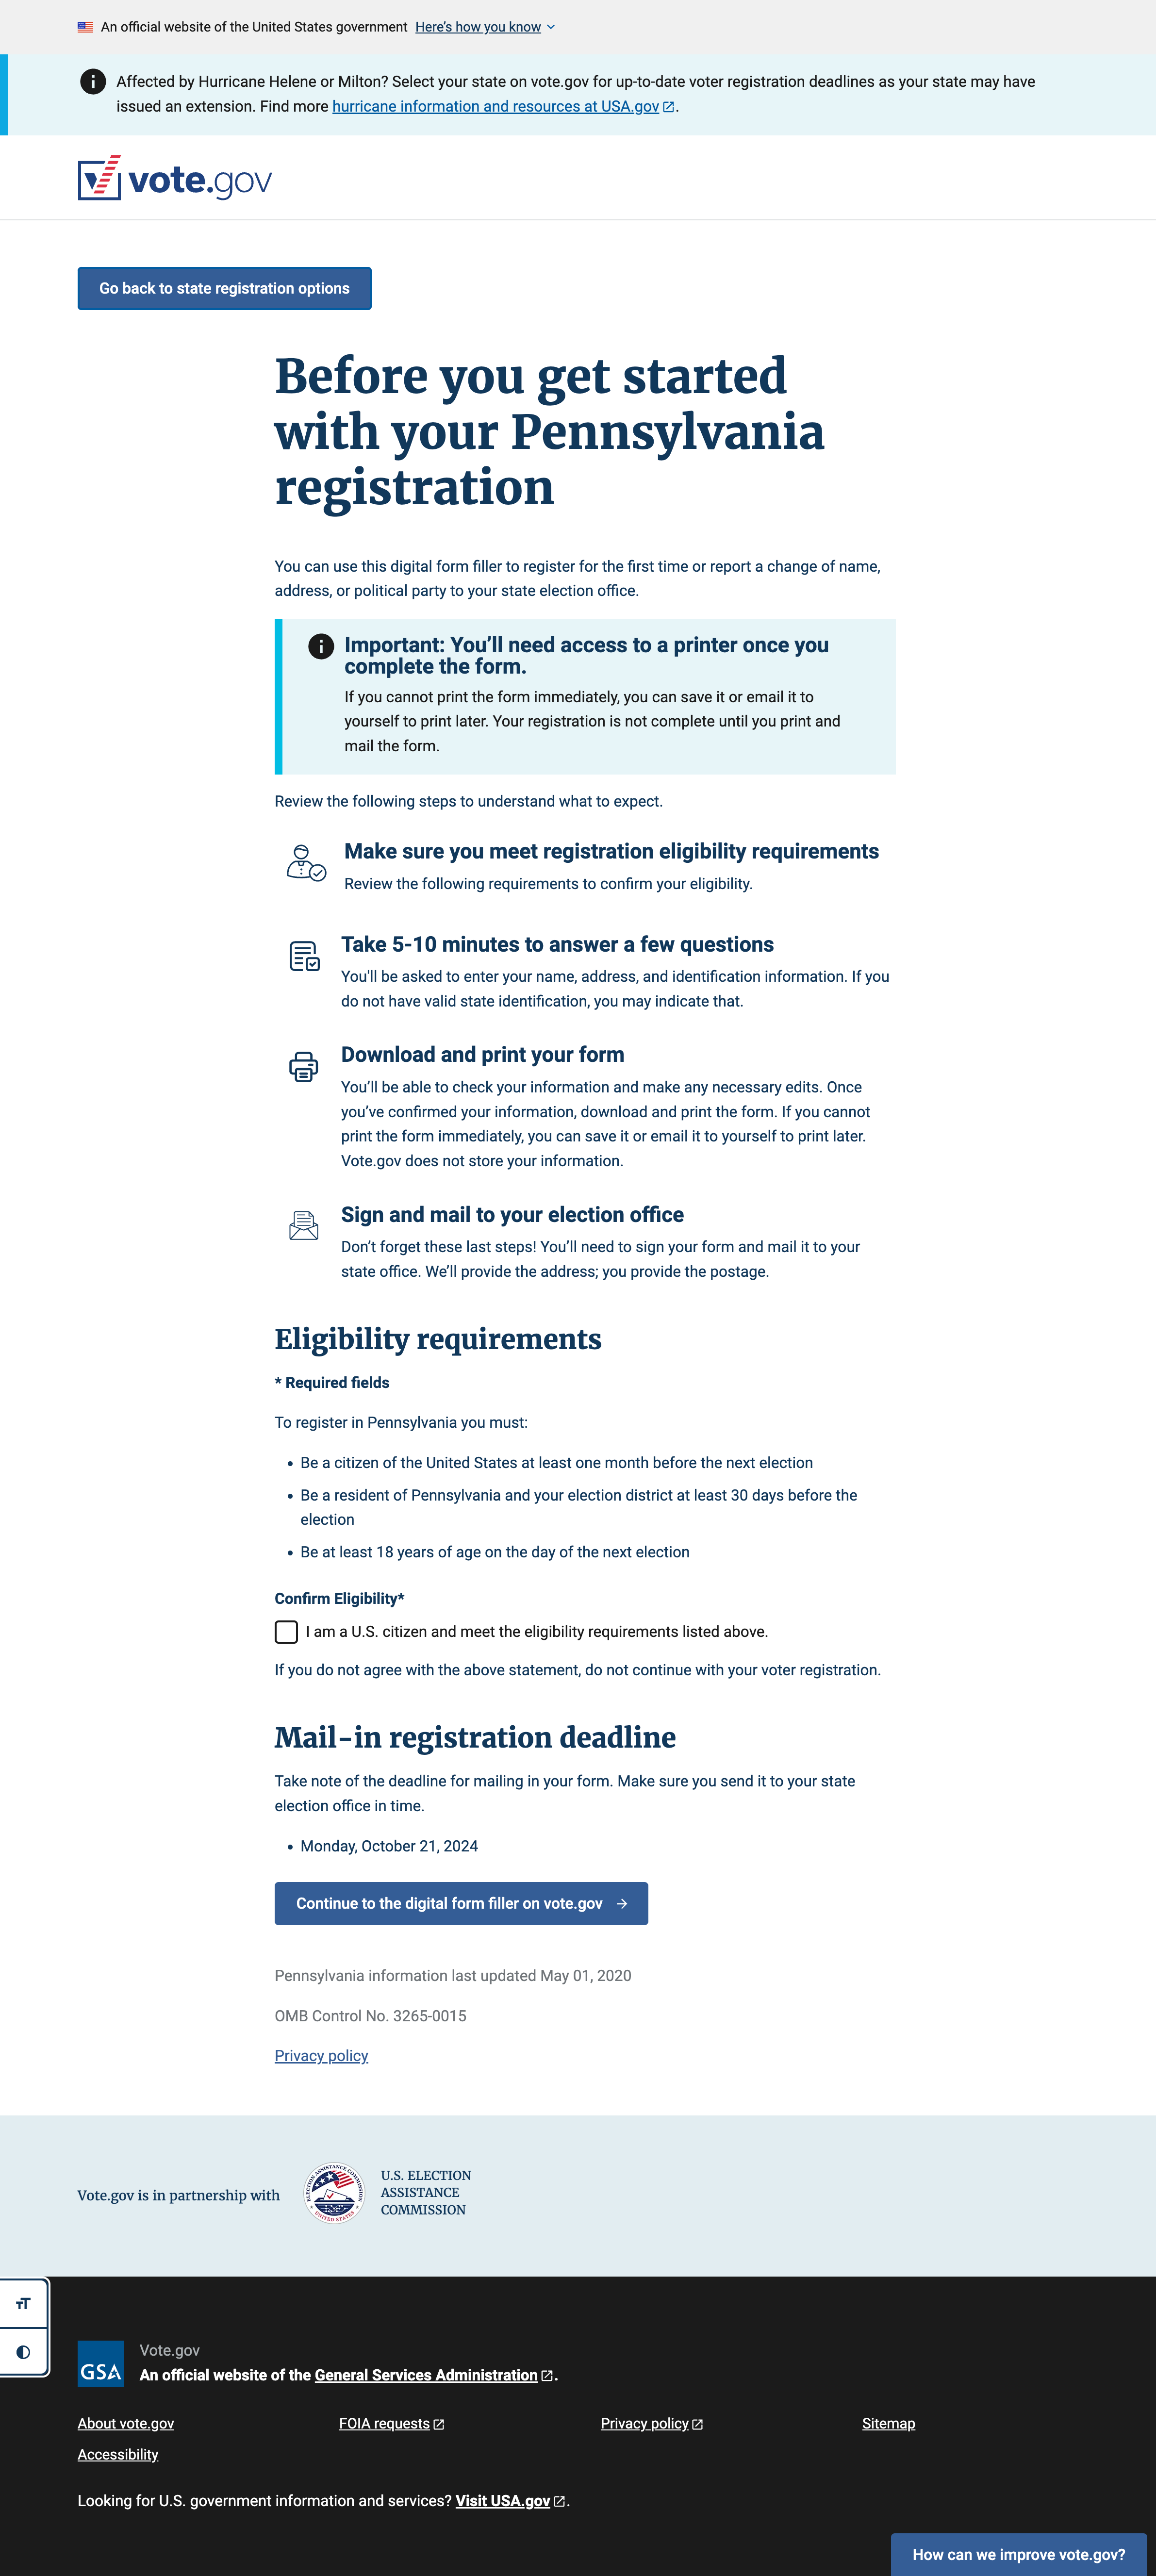
The NVRF form filler tool dramatically simplified the process of filling out the national form for voter registration
"Very clearly organized and helpful links embedded in the document. Also answers very key questions that many expats will ask."
— Research participant, Voting as a U.S. citizen living outside the U.S.
"I like the structure of it and I think it has just the right level of detail for people who might need help with this."
— Research participant, Voting as a military service member
"It gives me a level of confidence and an awareness of what, to know, what to expect, and how I can actually defend myself as and when needed."
— Research participants, Voting as a new U.S. citizen
Voter guides for situational barriers
Challenge: Beyond language and disability, could vote.gov effectively serve voters facing specific life circumstances that impact their ability to participate?
Approach
Created eight voter guides based on primary and secondary research with target populations
Content tested guides with representative users, measuring usefulness and gathering qualitative feedback
Analyzed traffic patterns and compared to estimated target population sizes
Examined language preference patterns to understand which guides served multilingual audiences
Key findings
Content testing participants rated guides 4.5/5 for usefulness on average
Guide traffic represented 12% of overall site traffic (August-November)
"Voting as a college student" guide had highest overall traffic with 404,667 users (~3% of target population)
Strong correlation between user demographics and guide usage—particularly for new citizens guide in non-English languages
Positive feedback highlighted clear organization, useful links, and consolidated information from multiple agencies
Strategic insight: Vote.gov filled critical content gaps that no other voter information site addressed comprehensively. The opportunity lies in dissemination—partnering with organizations serving these populations (colleges, naturalization programs, reentry services, housing assistance) to ensure guides reach people who need them.
Search optimization and site improvements
Challenge: Users struggled to find information they needed, and search results surfaced outdated or irrelevant content.
Approach
Implemented Touchpoints feedback form and recruited 10 users who had struggled to complete tasks on vote.gov
Monitored search.gov queries in English and Spanish to understand common questions
Systematically cleaned up outdated prioritized search results
Analyzed search patterns to identify content gaps and homepage visibility needs
Key findings
Direct user interviews revealed specific navigation pain points and content gaps
Search query analysis identified frequently-asked questions that weren't prominently addressed
Bilingual search patterns revealed similar information needs across languages
Outdated search results were creating friction and poor user experience
Strategic insight: Ongoing search monitoring and direct user recruitment provide essential feedback loops for continuous improvement. Small optimizations based on real user behavior compound into significantly better experiences.
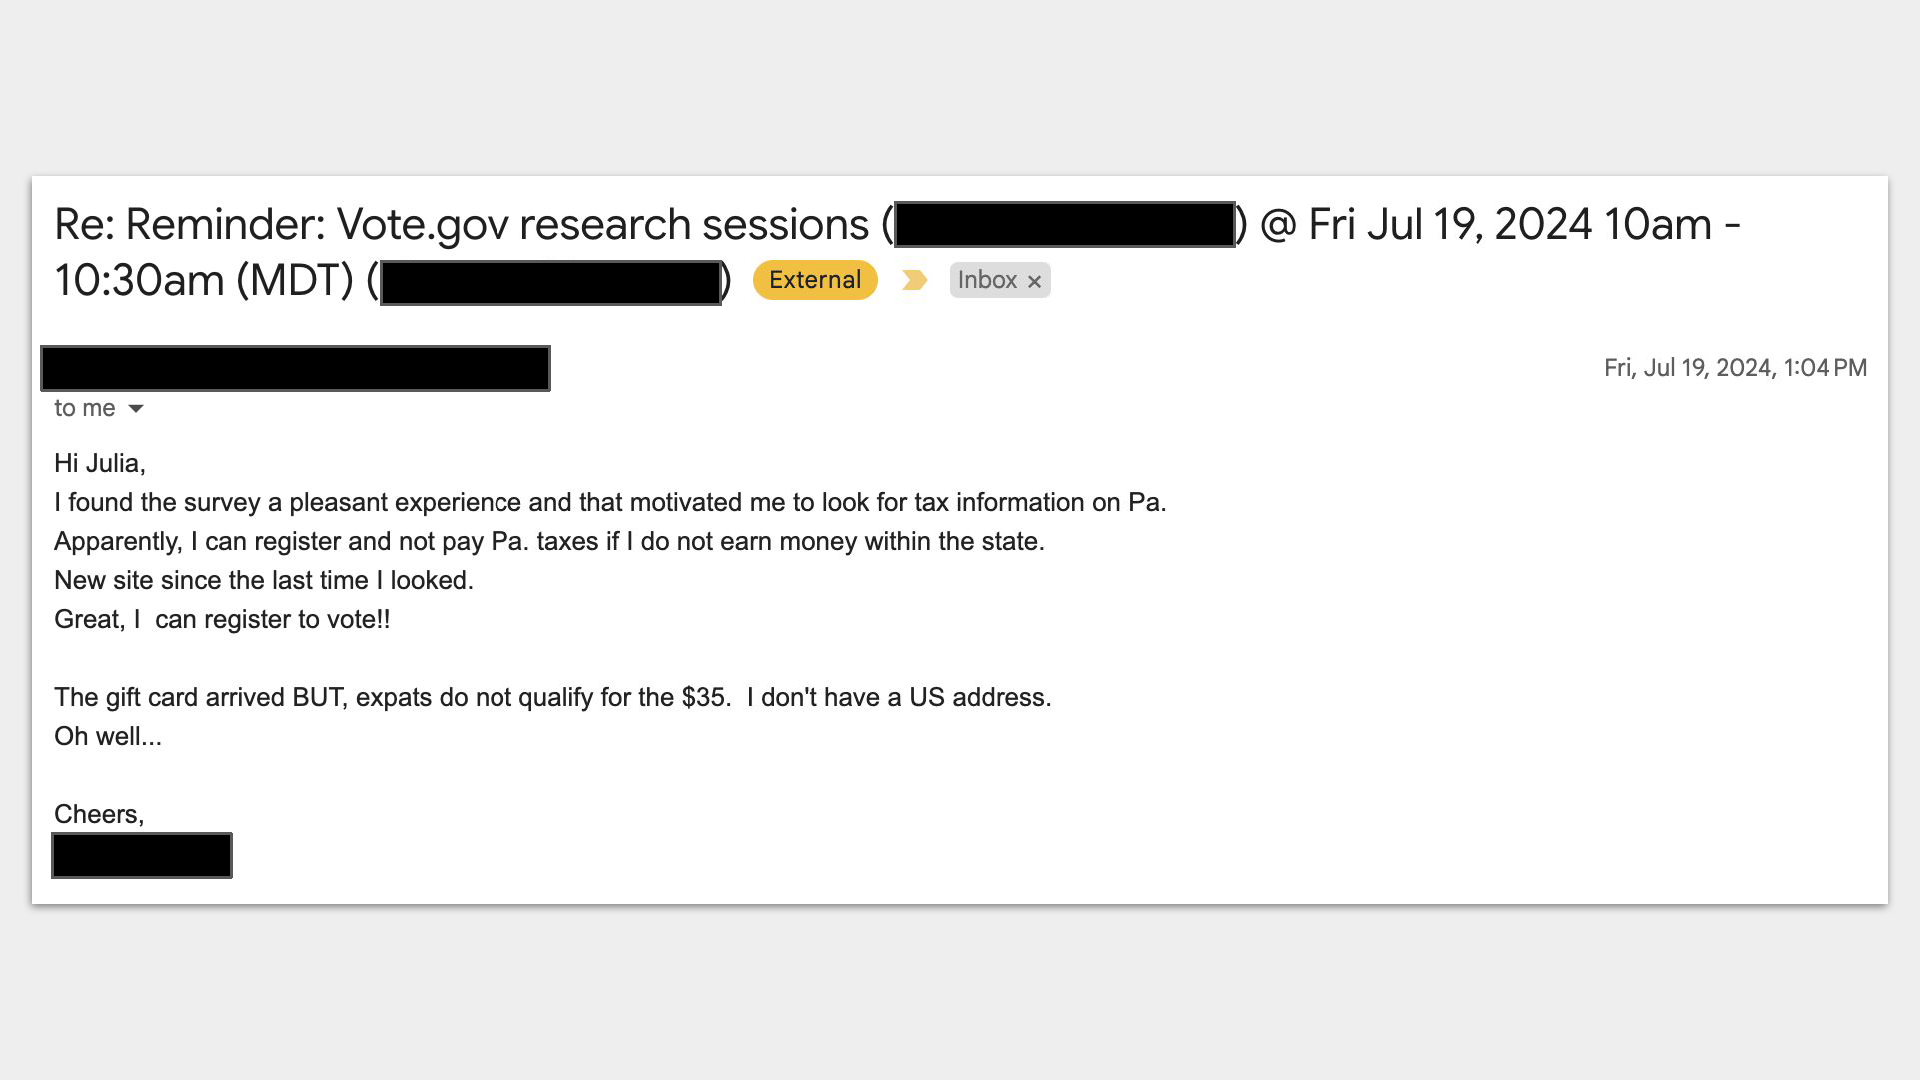
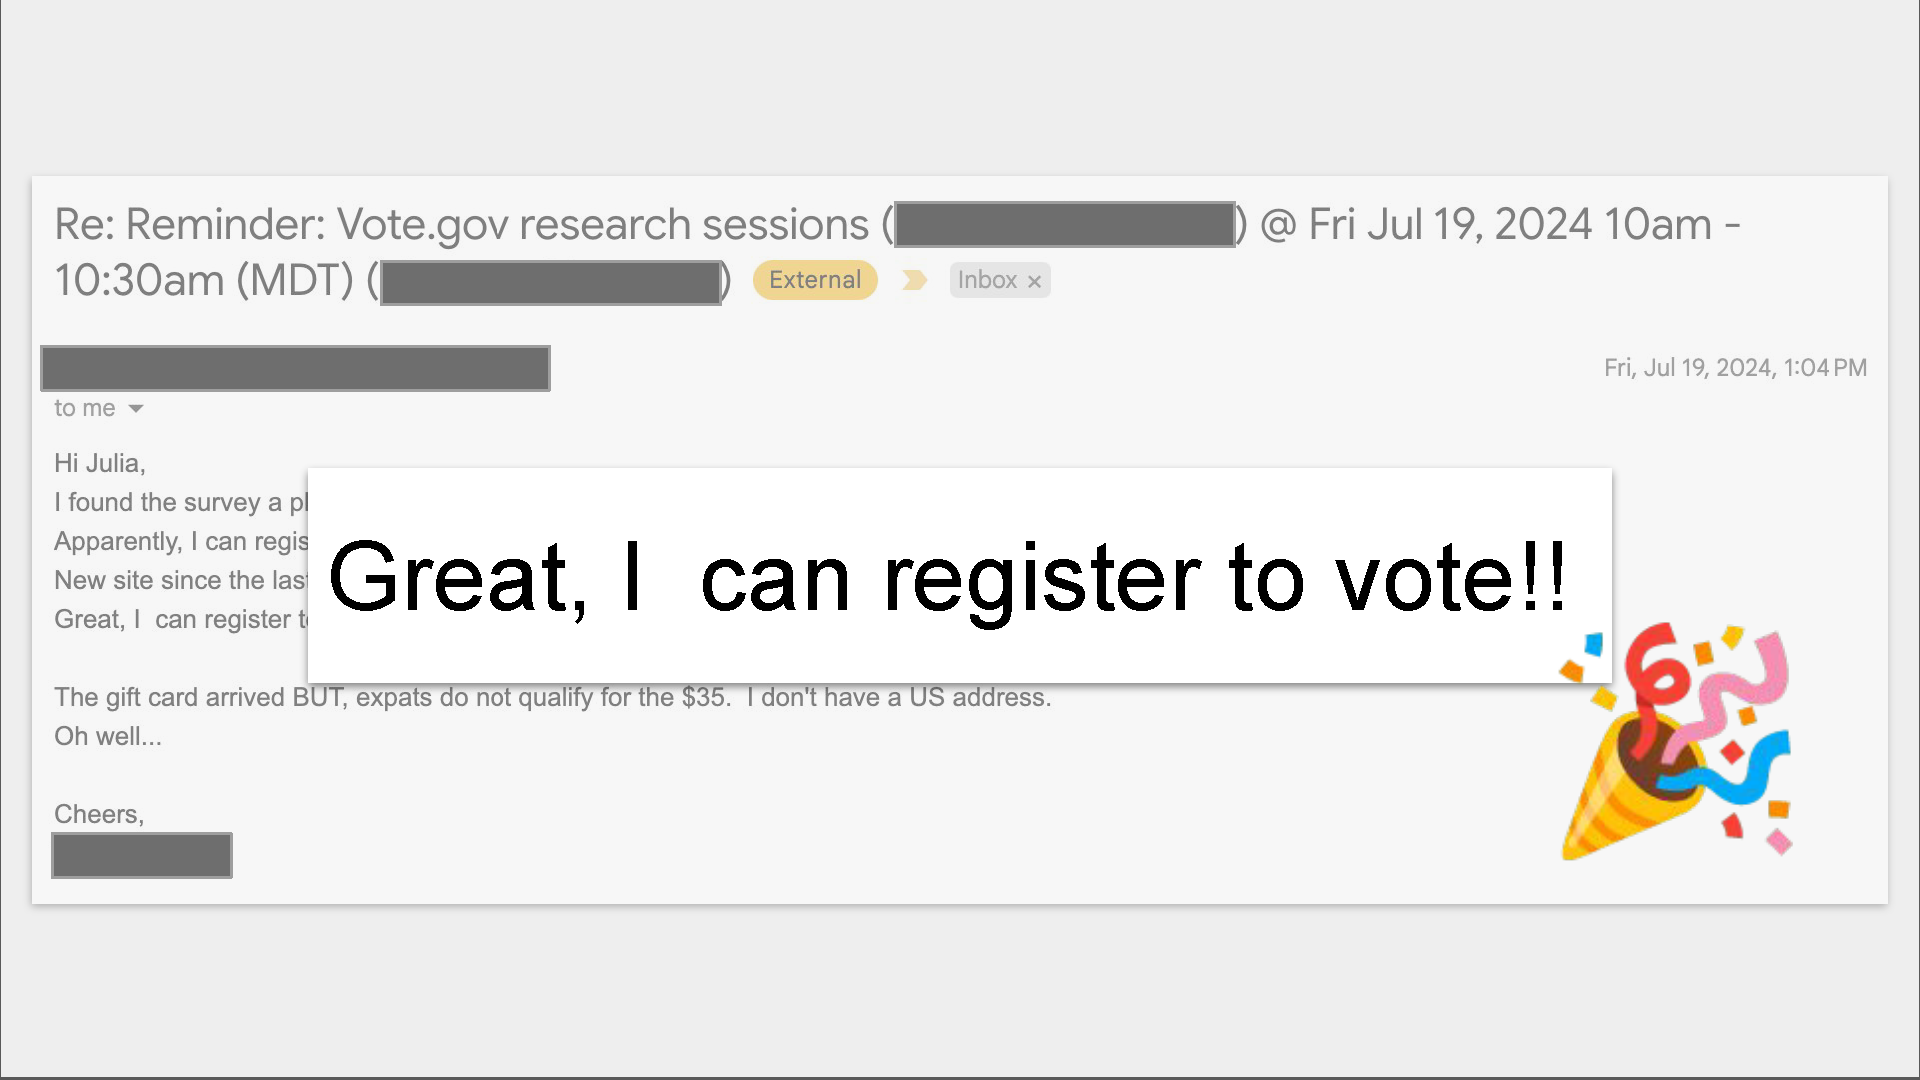
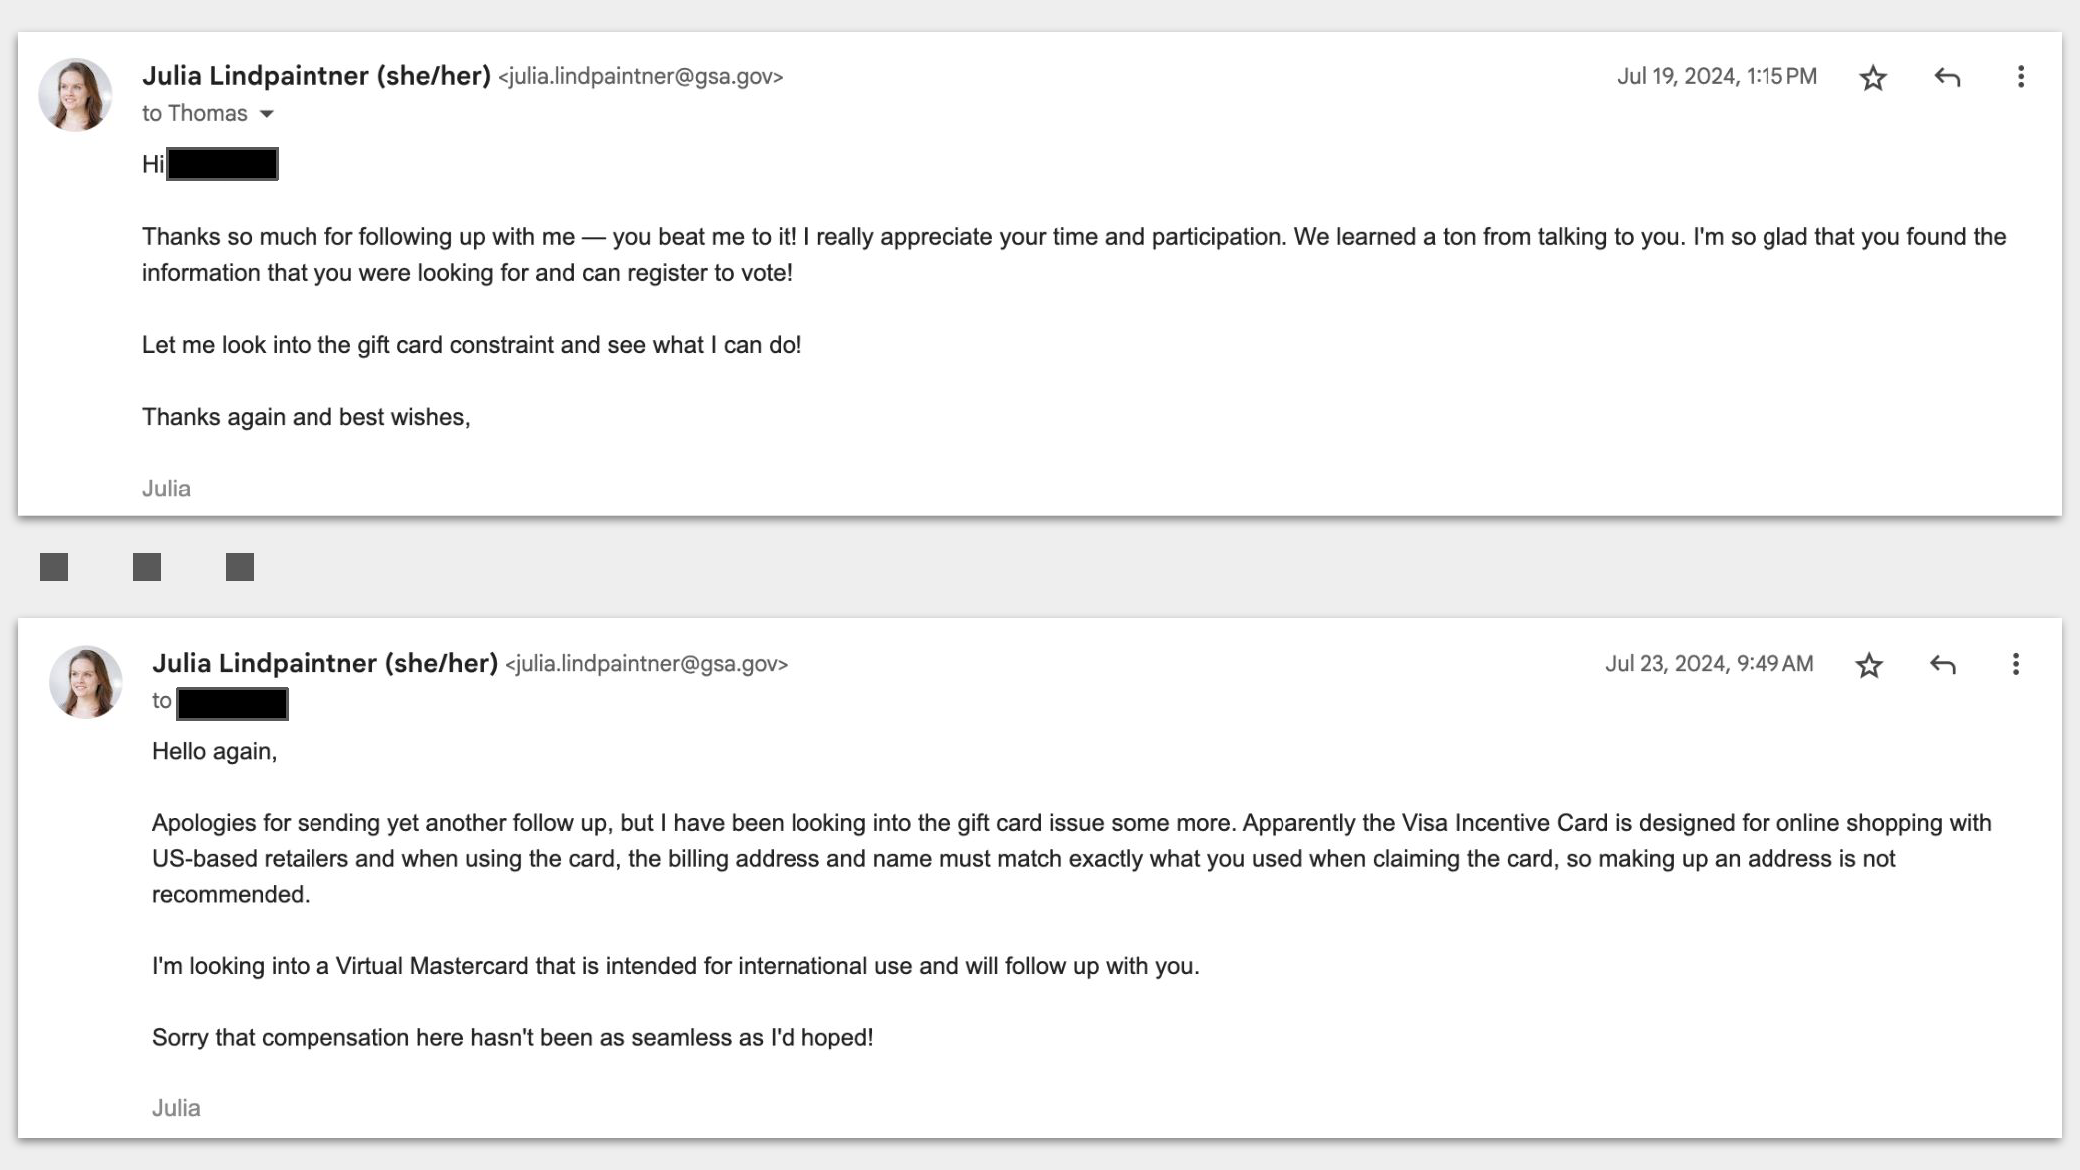
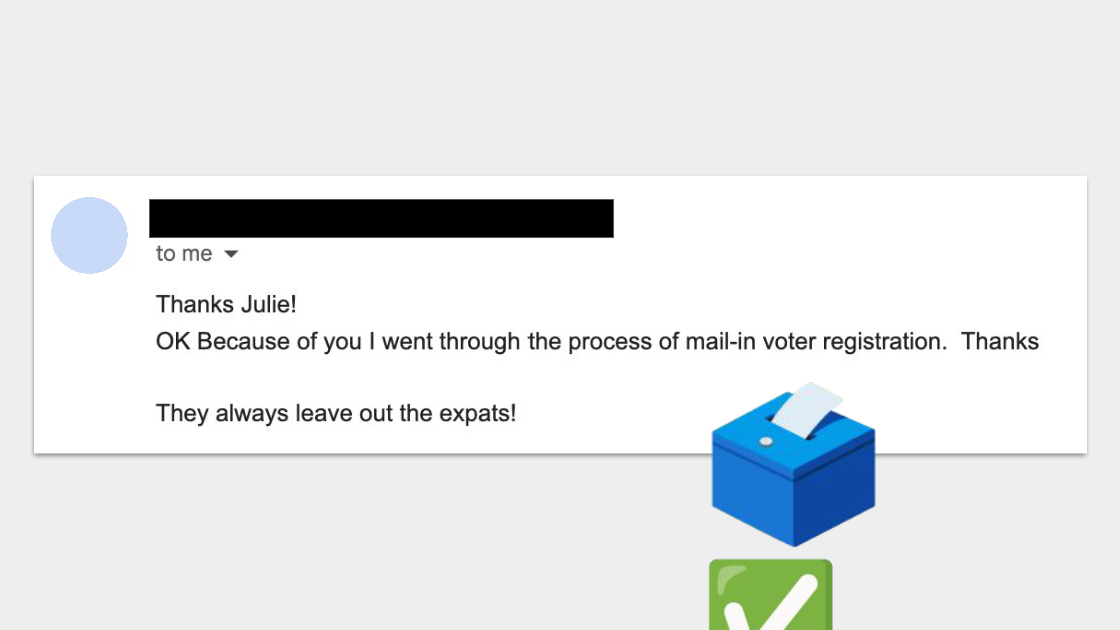
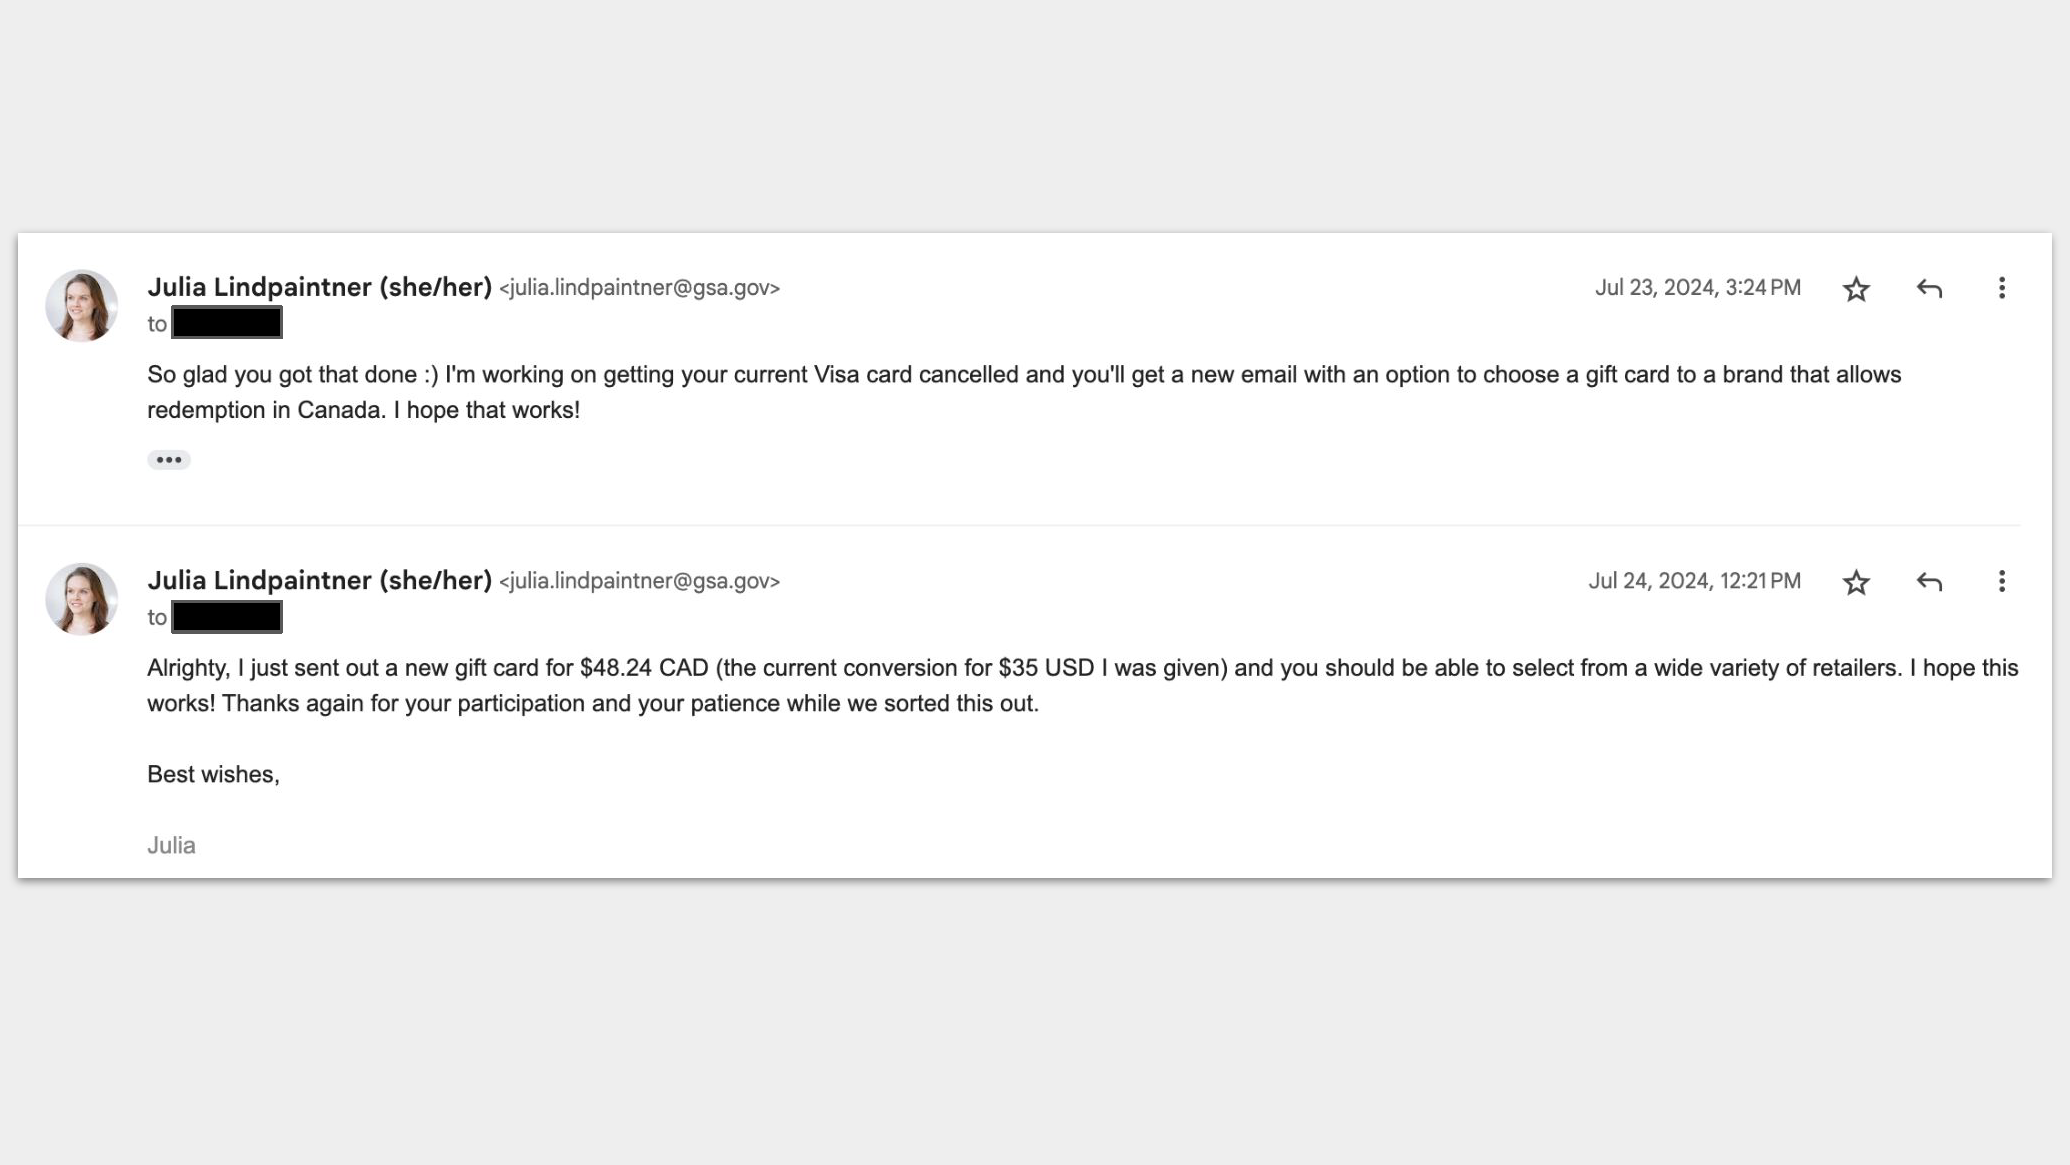
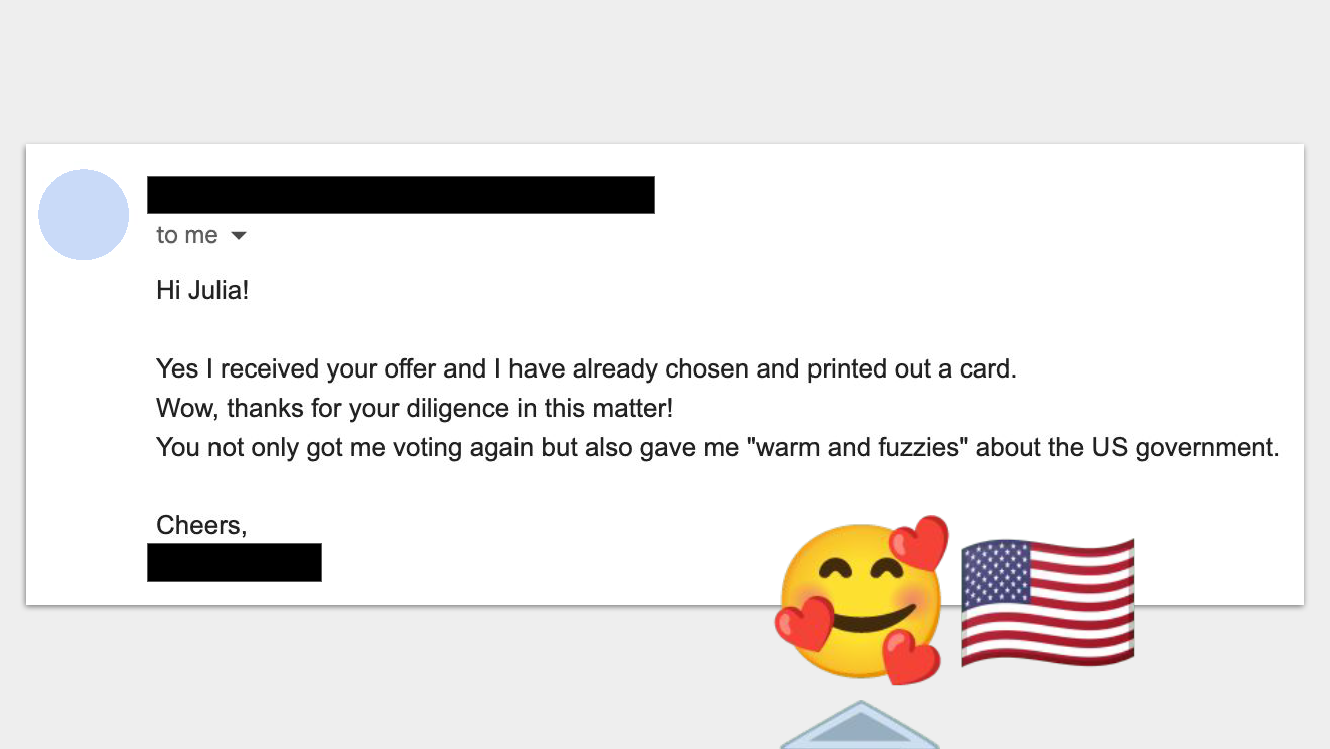
An email exchange with one of my research participants after the session. From our session, we learned that concerns about tax implications of registering to vote from abroad had stopped this voter from registering and exercising their right to vote for 17 years. This demonstrated how much you can learn from talking to real users and reminded me how much impact every interaction the public has with the government or a representative of the government can have on trust and perception.
Outcomes and strategic roadmap
Validated achievements
The evaluation confirmed vote.gov delivered measurable impact across all goals:
Highest traffic in vote.gov history (58% increase over 2020)
Most extensive multilingual voting resource available (20 languages, 97% population coverage)
Significant accessibility improvements benefiting millions of users
Strong user satisfaction with new content and tools
Successful handling of extreme load during debate traffic surge
Strategic opportunities
State partnerships (highest priority): Implement referral tracking and data-sharing agreements to directly measure registration impact. The Taylor Swift analysis proved this approach works—it shouldn't take a celebrity endorsement to understand vote.gov's effectiveness.
Outreach investment: Partner with ethnic media and community-based organizations to amplify reach of translation investment. Advocacy conversations revealed that trusted messengers are essential for reaching underserved populations.
Continued accessibility engagement: Maintain ongoing testing with users with disabilities and partnership with advocacy community for both feedback and dissemination.
Guide dissemination: Market voter guides to organizations serving target populations to maximize impact of specialized content.
Research innovation
This project required developing new frameworks for evaluating digital government services when traditional conversion metrics aren't available. The multi-method approach combining analytics, population data, statistical modeling, and qualitative research created a replicable model for measuring impact of aggregator platforms—services that succeed by connecting people to other services rather than delivering transactions directly.
The work also demonstrated the value of opportunistic research design—recognizing when unexpected events create natural experiments that can answer otherwise unanswerable questions, then moving quickly to capture the opportunity.
Skills demonstrated
Research strategy & design: Multi-method study design, mixed-methods integration, constraint-based planning, opportunistic research opportunities
Quantitative analysis: Google Analytics, statistical modeling, population data synthesis, ratio-based impact assessment
Qualitative research: Stakeholder interviews, unmoderated testing, direct user recruitment, content testing, competitive analysis
UX optimization: Search experience improvement, navigation consulting, content strategy, visual consistency review
Accessibility expertise: WCAG 2.1 evaluation, inclusive design consultation, assistive technology considerations
Communication: Executive summary writing, data visualization, strategic recommendations, cross-functional collaboration
See more case studies from 18F
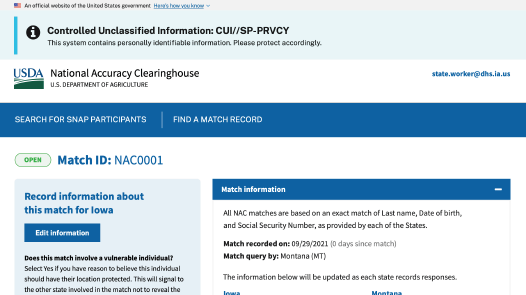
National Accuracy Clearinghouse: Leading research and design for a new interstate data matching system

The U.S. Data Federation: Building shared infrastructure for federated data and securing the longevity of a 10x effort through resources.data.gov